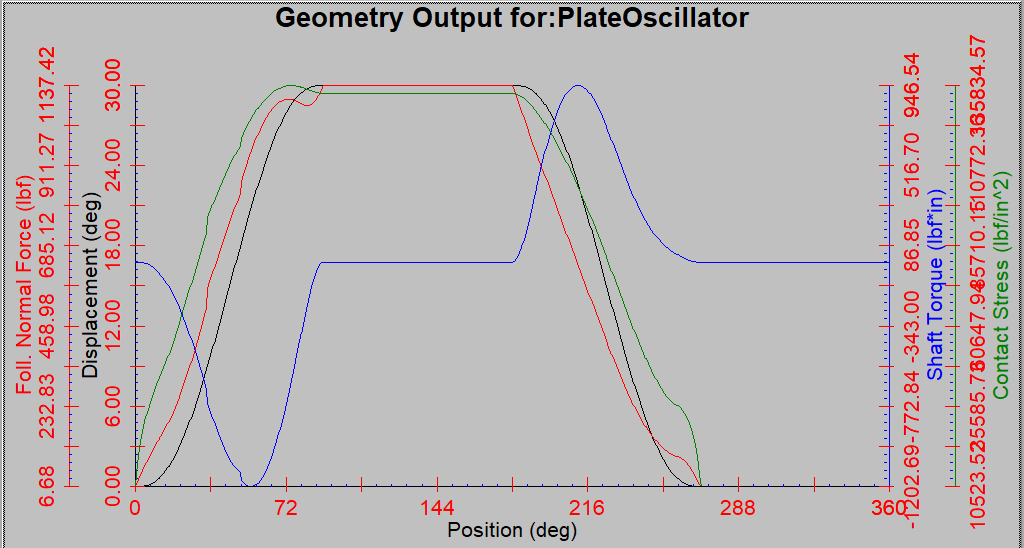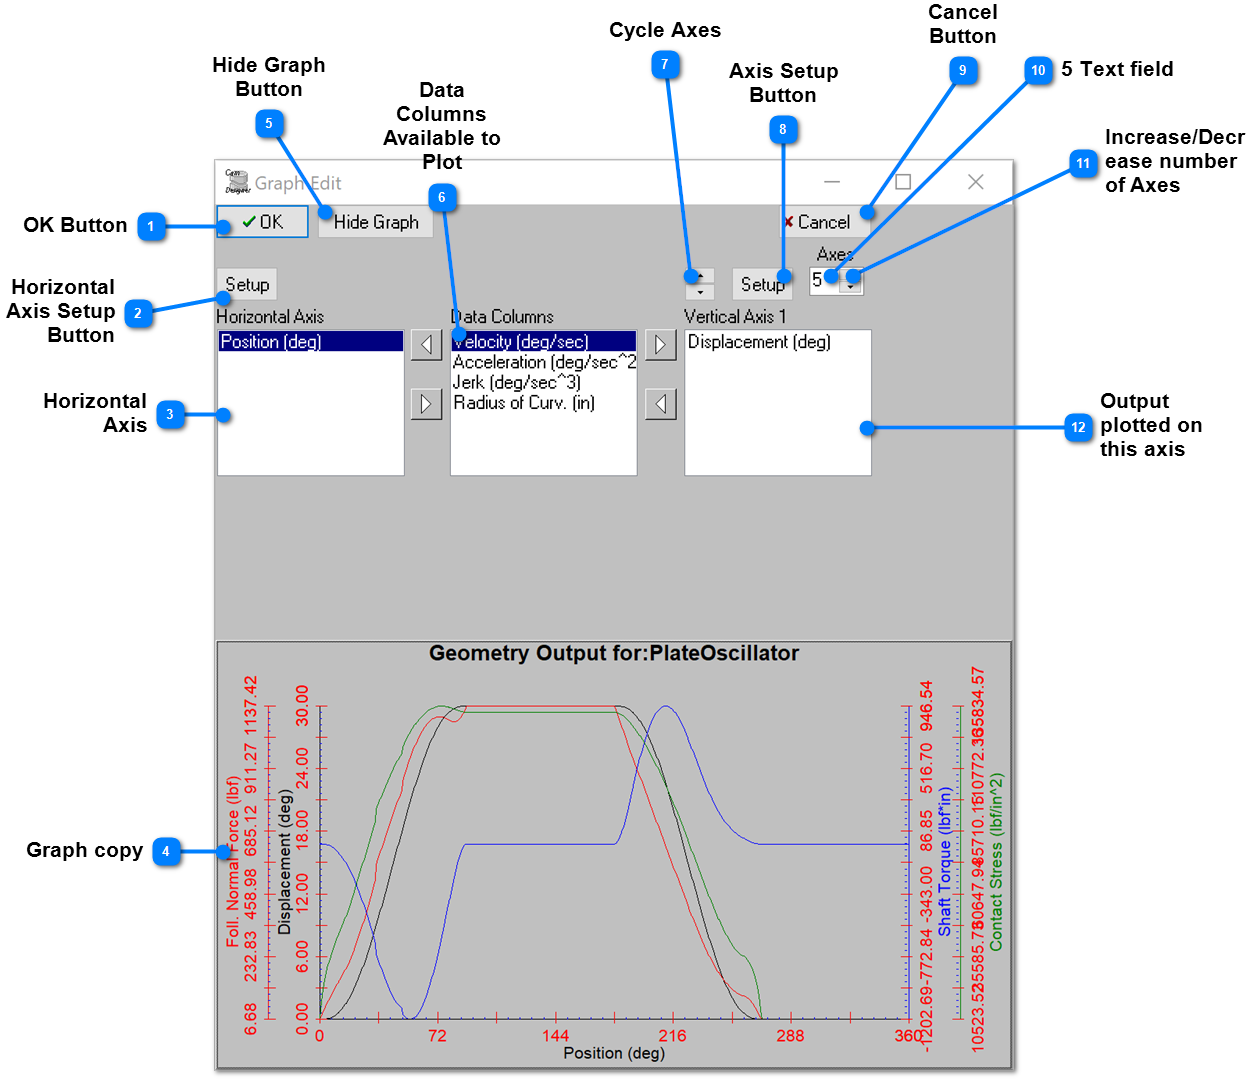
The graph of the output can be setup with a horizontal axis and 8 vertical axes. To see the Graph Setup Dialog, right click on the graph, or click the Edit Graph button (28) in Geometry. A copy of the graph will be displayed with what os plotted or the horizontal axis and what is plotted on each of the vertical axes. In the center list (Data Columns) is a list of computed columns in the tabular output that are available to show on one of the vertical axes. To see how this is done watch this short video.
|
OK Button |
|
|
Once the settings are as the user desires, click this button and the settings will be transferred to the original graph. |
|
|
|
|
|
Horizontal Axis Setup Button |
|
|
To change the settings of the horizontal axis, there are two ways to accomplish this. First, this button can be clicked, or second, hover the mouse over the horizontal axis, left click and right click after the axis begins to flash. |
|
|
|
|
|
Graph copy |
|
|
The graph shown in the dialog is a copy of the original graph. Therefore, if the cancel button is clicked no changes will be made to the original graph; only if the OK button is clicked will the changes made here be transferred to the original graph. NOTE: when you exit Cam Designer SE, the graph settings will be stored and when it is started again, those settings will be how it appears again. |
|
|
|
|
|
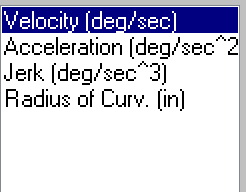
Data Columns Available to Plot |
|
|
The center list shows the columns that are available for plotting. The selection of items to plot can be made in the Tabular Output. See this. |
|
|
|
|
|
Axis Setup Button |
|
|
Click this button to change the settings on the axis shown, or hover over the axis, left click and right click after the axis flashes. |
|
|
|
|
|
Increase/Decrease number of Axes |
|
|
Select the number of axes to be shown. The maximum is 9. That is one horizontal axis and 8 vertical axes. |
|
|
|
|